The real answer starts with the installed cost before incentives — not after. Here is what that number includes, how incentives reduce it with visible math, what financing actually costs compared to cash, how to evaluate a quote, and what the full 25-year picture looks like.
What a system costs before incentives
A typical Minnesota single-family home uses 800 to 1,000 kWh of electricity per month. A system sized to offset that usage runs 8 to 10 kW. In Minnesota in 2024–2025, the installed cost for that system runs $24,000 to $32,000 before any incentives. The standard comparison metric is cost per watt — the current Minnesota range is $2.80 to $3.50 per watt installed.
That number is a complete package: solar panels, inverter, racking and mounting hardware, wiring and electrical work, permit fees, utility interconnection fees, and labor. A reputable installer prices the complete job — these are not items the homeowner negotiates separately.
Included: Panels, inverter, racking, wiring, electrical work, permit fees, utility interconnection application and fees, labor, and system commissioning.
Not included: Battery storage ($12,000–$16,000 per unit, separate decision). Roof replacement or repair if needed before installation — cost varies by scope. Electrical panel upgrades if the existing panel lacks capacity ($1,500–$3,000 when needed). A good installer identifies any of these during the site assessment, before quoting.
What drives cost higher or lower
The $24,000 to $32,000 range is real. Understanding what pushes a system toward each end helps before talking to an installer.
Drives cost higher
- Steep or complex roofline
- Multiple roof planes
- Electrical panel upgrade needed
- Premium panels or microinverters
- High municipal permit fees
- Battery storage added
Drives cost lower
- Simple single-plane south-facing roof
- Newer panel with available capacity
- Standard equipment tier
- Streamlined local permitting
A ranch-style home with a simple south-facing roof and a recently updated electrical panel is closer to $24,000. A two-story home with a steep, complex roofline and an aging panel is closer to $32,000 — or above it if significant additional work is required.
On equipment: microinverters (Enphase is the market leader) cost more than string inverters but provide panel-level monitoring and eliminate the single point of failure a central inverter creates. Neither is categorically better — they are tradeoffs worth understanding before accepting or rejecting a quote based on them.
What it costs after incentives
Using the reference system throughout this guide: 9 kW, $27,000 installed, Twin Cities suburb, Xcel Energy customer, cash purchase.
$27,000 — gross installed cost
−$8,100 — federal Investment Tax Credit (30%) · returned through spring tax filing
−$1,850 — Minnesota sales tax exemption · already excluded from invoice, no action needed
$17,050 — effective day-one cost before Solar*Rewards
−$8,500 — Xcel Solar*Rewards · ~$850/yr for 10 years based on production
~$8,550 — effective net cost after all incentives over 10 years
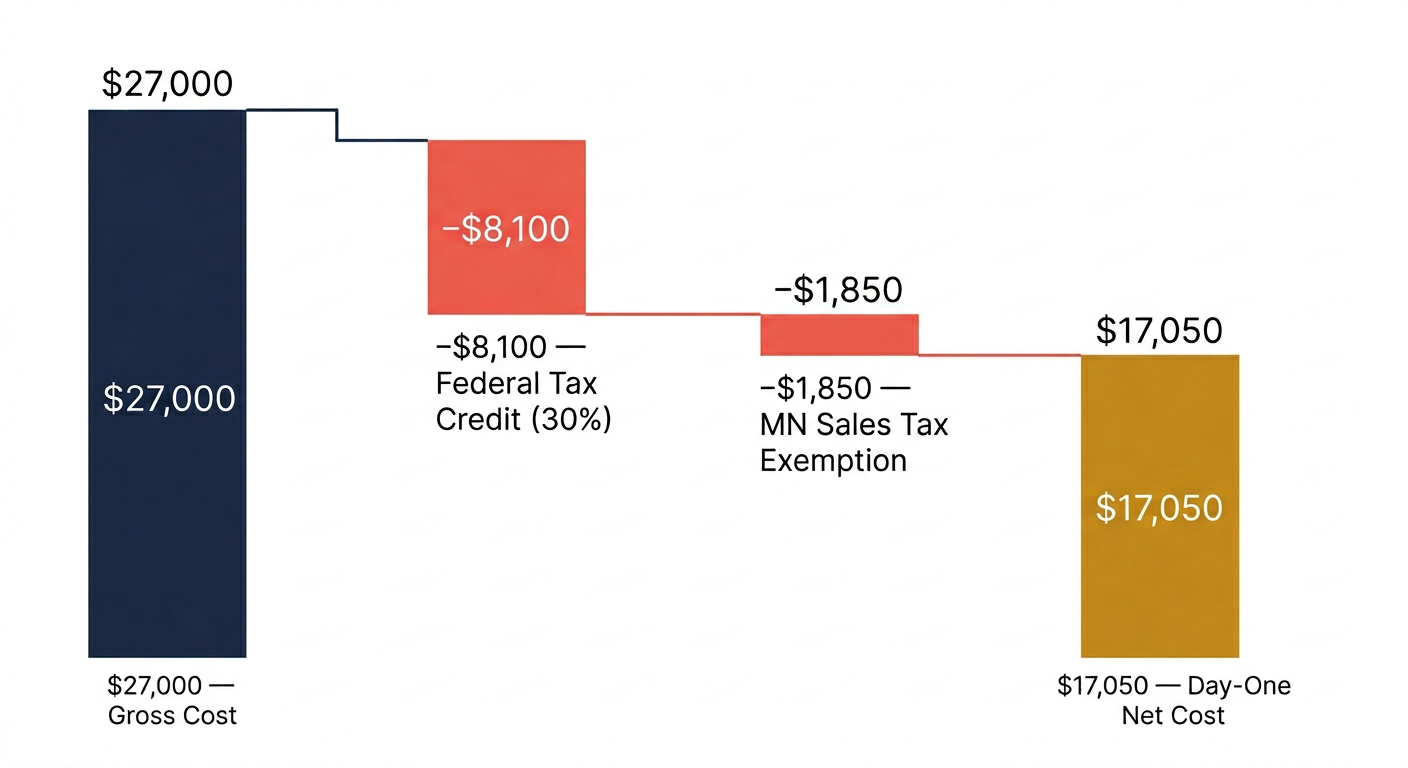
From $27,000 gross: −$8,100 federal credit → −$1,850 sales tax exemption → $17,050 day-one net cost. Solar*Rewards reduces this further over 10 years.
The federal tax credit reduces your tax liability — it doesn't reduce the purchase price at closing. The homeowner pays the full $27,000 to the installer and recovers $8,100 through their federal tax return the following spring. For anyone financing, this timing creates a specific issue covered below.
How financing changes the math
Most Minnesota homeowners do not pay $27,000 cash for a solar system. The financing path chosen affects the total cost significantly — and this is where the most financial misunderstanding in the solar industry occurs.
Cash purchase
Pay $27,000, receive $8,100 back through the tax filing. Net investment $18,900, zero interest costs. This is the benchmark against which every other option should be measured.
Solar loan
Current solar loan rates in 2024–2025 run approximately 5–10% depending on lender, term, and credit. The monthly payment is often framed as comparable to the current utility bill — but that framing is not a financial analysis.
| Option | Rate / Term | Total interest | Effective system cost | 25-yr net benefit |
|---|---|---|---|---|
| Cash purchase | — | $0 | $18,900 | ~$47,000 |
| HELOC / home equity | ~4–5%, varies | ~$5,000–$8,000 | ~$23,000–$27,000 | ~$39,000–$42,000 |
| Solar loan | 7%, 20 yr | ~$16,300 | ~$35,200 | ~$31,000 |
| Solar loan | 10%, 20 yr | ~$24,000+ | ~$43,000+ | ~$23,000 |
The solar loan timing trap: Many solar loans begin with a lower payment that assumes you will apply the $8,100 federal tax credit to the principal within 12–18 months of installation. If you don't — because your tax liability was insufficient, because you used the refund for something else, or because no one explained the requirement — monthly payments recalculate upward, sometimes by $50+/month. Before signing any solar loan, ask the lender exactly what happens if the tax credit isn't applied on schedule.
Home equity line of credit
Typically the lowest interest rate of any financing path because the loan is secured by the home. Interest may be tax-deductible — confirm with a tax advisor. The tradeoff: you're borrowing against home equity, which carries different risk than an unsecured loan. For a homeowner with substantial equity and a clear plan to stay put, this is often the most cost-effective financing path available.
Lease and power purchase agreements
Under these arrangements the homeowner doesn't own the system. A financing company installs the panels, retains ownership, and claims the federal tax credit. The homeowner makes monthly lease or per-kWh payments instead of a full utility bill. The tradeoff is significant: the financing company retains the tax credit and takes a margin on the electricity produced. Leases and PPAs also complicate home sales — the buyer must assume the agreement or the seller must buy out the remaining term. Compare the total cost over the full agreement term against the cost of ownership under a loan before deciding.
How to know if a quote is reasonable
The benchmark is cost per watt before incentives. A reasonable installed cost for a quality system in Minnesota in 2024–2025 is $2.80 to $3.50 per watt. A 9 kW system at $3.00/watt is $27,000. A quote significantly above $3.50/watt warrants questions about what drives the premium. A quote significantly below $2.80/watt warrants equal skepticism — understand what is being cut.
Itemized breakdown: Equipment costs, labor, permit fees, and interconnection fees as separate line items. A reputable installer provides this. A refusal to itemize is a reason to ask more questions.
Equipment specifics: Tier-1 panel manufacturers include Qcells, REC, and Panasonic. LG exited the solar panel market — existing panels may be in circulation but long-term warranty support is uncertain. For inverters, ask whether the quote uses microinverters or a string inverter and why.
Warranty terms: 25-year production warranty is standard for tier-1 panels. Inverter warranties run 10–12 years standard, with extensions available. Installer workmanship warranty should be at least 10 years. Ask for all three in writing before signing.
Payback projection: Ask for a payback estimate based on your actual last 12 months of electricity bills — not a national average or a round number estimate. If the installer can't or won't do this, that's a signal.
The 25-year cost picture
For the reference homeowner paying cash: $27,000 invested. $8,100 returned through the tax credit in year one. $8,500 earned through Solar*Rewards over 10 years. Approximately $59,000 in cumulative electricity savings over 25 years at a conservative 3% annual rate escalation. Total financial return: roughly $76,000. Subtract the $27,000 system cost and approximately $2,000 for an inverter replacement around year 12–15. Net lifetime benefit: approximately $47,000.
For a homeowner who finances at 7% over 20 years: total outlay rises to approximately $35,200 due to interest, but the total return over 25 years remains roughly $76,000. Net lifetime benefit: approximately $31,000. Financing reduces the return — it doesn't eliminate it.
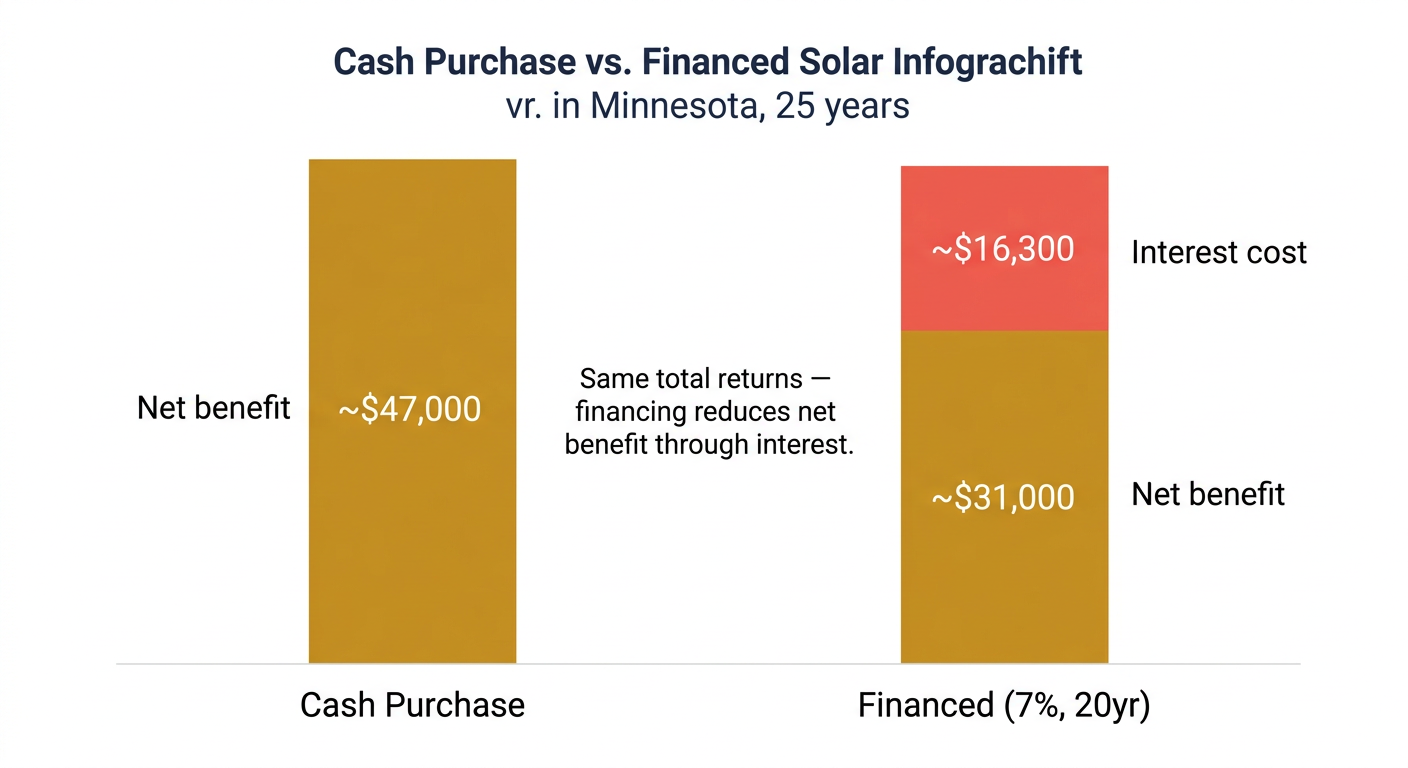
Cash purchase: ~$47,000 net benefit over 25 years. Financed at 7% over 20 years: ~$31,000 net benefit. Total returns are identical — financing reduces the net benefit through interest cost.
Inverter replacement: A string inverter typically needs replacement once during the system's 25-year life — around year 10–15 — at $1,000–$2,500 installed. Microinverters last longer but individual units can fail. This cost is modest relative to the system's total output, but a homeowner who discovers it for the first time when their inverter fails at year 12 will feel it was hidden from them. It should not be.
What about adding a battery?
A single battery unit — a Tesla Powerwall or equivalent, approximately 13.5 kWh of storage — adds $12,000–$16,000 before incentives, or roughly $8,400–$11,200 after the 30% federal tax credit. Xcel Energy has storage incentives available — ask your installer about current rates and availability.
The honest financial case for battery storage in Minnesota is narrower than the marketing suggests. Minnesota does not currently have time-of-use electricity rates that would make battery arbitrage — storing cheap daytime solar to avoid expensive evening electricity — financially valuable. The primary benefit in Minnesota is backup power during outages. That has real value, but it functions more like an insurance purchase than an investment with a calculable payback period.
A homeowner who was told that battery storage dramatically improves solar economics in Minnesota should ask their installer to show the specific math for their situation before committing to the additional cost.
Not sure if your home is a good solar candidate?
Costs only matter if the home actually qualifies. Answer 7 questions and find out.
Take the Free Self-Assessment →Frequently Asked Questions
Equipment tier, labor rates, overhead, and margin all vary by installer. A company with a large sales team and TV advertising has higher overhead than a smaller regional installer — and that overhead ends up in the quote. Equipment choices also vary: microinverters cost more than string inverters; premium panel tiers cost more than standard tiers. Neither choice is inherently better or worse. Ask every installer to quote the same system size and equipment tier so you're comparing apples to apples. A $5,000 spread between two quotes on the same system warrants a direct question about what's different.
Permit fees vary significantly by municipality. Some Twin Cities suburbs charge $100–$200 for a residential solar permit. Others charge $500–$1,500. The installer handles the permit application, but the fee appears on the itemized quote. If you're comparing quotes across installers, confirm that permit fees are included in both. A quote that excludes permit fees will look lower and then surprise you later. Ask each installer what the permit fee is for your specific city.
Yes — and you should. Three quotes from licensed Minnesota solar contractors is a reasonable standard before signing. Ask each installer to specify: system size in kW, equipment manufacturer and model numbers, inverter type, expected first-year production in kWh, permit and interconnection fees, and warranty terms. With those details standardized across quotes, the comparison is meaningful. A quote significantly below the others deserves as much scrutiny as one significantly above.
Yes, in two ways. First, if the roof needs replacement within 5 years, it's almost always better to replace it before installing solar — removing and reinstalling panels costs $1,500–$3,000 and is disruptive. A responsible installer will note roof condition during the site assessment and may decline to install on a roof near end of life. Second, steep pitch and complex geometry slow labor, add racking complexity, and push costs higher even if the roof is in good condition. A site assessment by a licensed contractor should surface any roof-related cost factors before you receive a final quote.
An owned solar system typically increases resale value — studies consistently show buyers pay a premium for homes with owned solar. Lawrence Berkeley National Laboratory data suggests a premium of approximately $4 per watt of installed capacity, or roughly $36,000 on a 9 kW system, though this varies by market. The system doesn't need to reach its payback period for the investment to make sense — the resale value premium is real and captures much of the remaining value. Leased systems are different: the buyer must assume the lease or the seller must buy it out, which can complicate the sale.